*ISTE Workshop: Transitioning to the Common Core with Google Apps – Join me!
Any teacher who has embarked on a research writing unit or taught students how to write a research paper knows it is a arduous and, often, unrewarding task.
After teaching the research paper this year, I knew my students needed to refine their research skills. Many needed more practice “searching smarter,” evaluating resources and analyzing information. That said, I dreaded the prospect of reading another 170 research papers.
The Common Core Standards emphasize the importance of conducting both “short as well as more sustained research projects.” They also require that students “use technology…to display information flexibly and dynamically” and “synthesize multiple sources on the subject, demonstrating understanding of the subject under investigation.”
Inspiration struck one night when I stumbled on an infographic titled “Get More Out of Google.” Infographics are research dense, visually interesting and a fairly new trend in the technology space. The next day, I asked students to explore a collection of infographics in small groups. I encouraged them to discuss the infographics.
- Which infographics were most compelling?
- How was research visually displayed?
- Did they want to learn more about any of the topics covered in the infographics?
 Most of my students had never heard the word “infographic,” which surprised me. I was excited to see them so engaged in the process. They were clearly captivated.
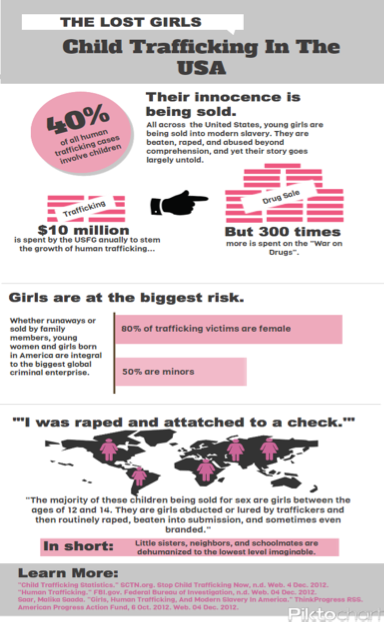
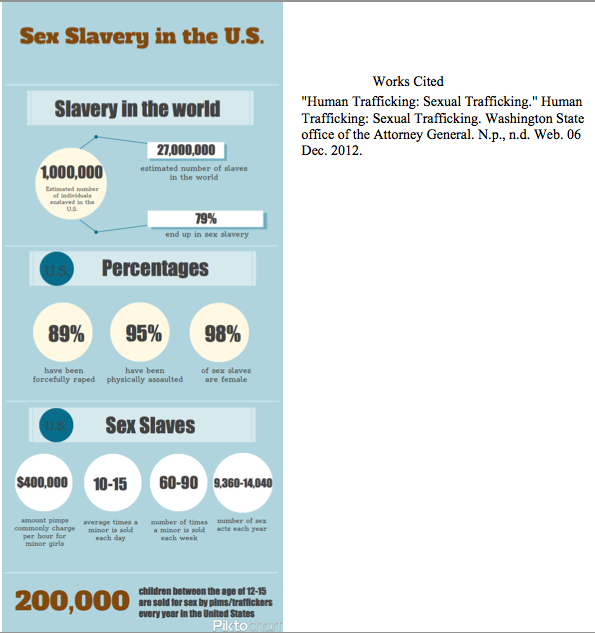
That night I posted a discussion topic on our Collaborize Classroom site asking students to select between two “big” ideas, modern day slavery and gender inequality. I explained that they would be researching one of these topics to create their own infographics.
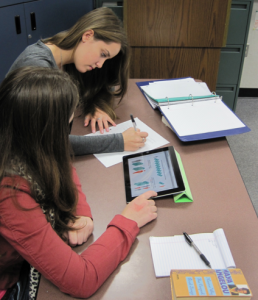
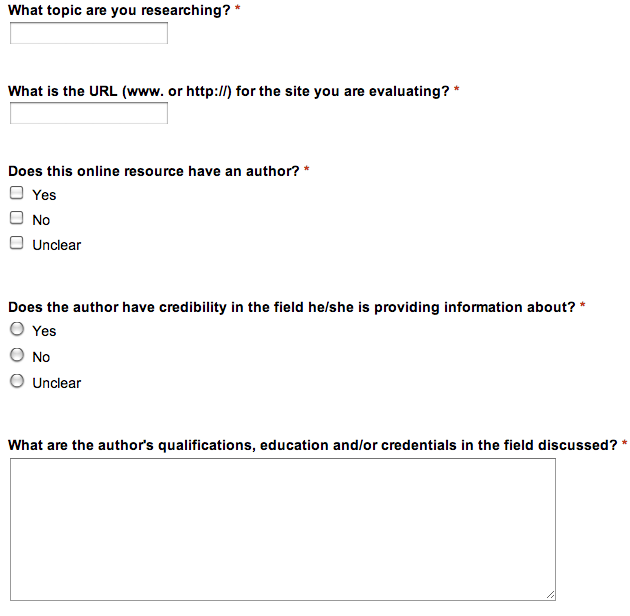
 I took my classes to the computer lab to conduct their research. I guided them through a “Got Credibility?” Google form I created to train them to analyze their resources to ensure the information they found was credible.
 Once students had found compelling research and evaluated the credibility of the information they found, they began designing their own infographics using Piktochart. It was an interesting challenge to communicate their main points using charts, maps, graphs, and images.

The end products were a wonderful mix of research, media and design! I don’t even think most of my students realized they were doing “research” because they enjoyed the process so much.

7 Responses
This is an incredibly good blog, Catlin: Innovative, very well written & clearly explained (with links to helpful sites). I am impressed, to say the least. I understand you will be publishing a 2nd book; I hope you will keep us posted on its progress.
This is fantastic, Catlin. We will surely invite our tutors and their tutees to try out the cool infographic approach to research papers you’ve detailed here. Thanks for sharing!
Great! I’m glad this will inspire other educators to use infographics to creatively teach research!
Catlin
I am planning on introducing my 8th graders to chemistry through creating infographics on a topic I give them. I signed up for Piktochart and now I have a few questions for you:
– How did you assess this?
– How did they share their final products? I would love to print them out, but I think that would cost a lot of money.
– How can I make sure that my students don’t end up making a small, fluffy infographic, but rather one that is informationally dense and shows deep investigation into a topic?
Hi Rocio,
When I assessed my student’s infographics, I was looking at three components: 1. Content– research, statistics, references, etc. ; 2. Visuals -Color coding, graphics, maps, images and icons; and 3. Knowledge – is it clear from research and construction that they understand the significance of the data they presented.
Because my students used the free version, I had them download their final product as an image to the computer they were working on. Then I had them create a Google drawing, since we regularly use Google apps and drawings are easy to share, and upload the image. Once the image was uploaded and the Google drawing was labeled with the correct naming strategy [class name – last name – title of assignment], I had them share them directly with me. This made it possible to do the entire assignment without using paper. This was a benefit for me as printing is costly.
To answer your third question, I suggest hitting the research piece key. When assigning a visual to students to complete, they tend to jump in without conducting thorough research. This piece is critical if they are to have a substantial finished product. I would dedicate time to teaching them how to research, evaluate the credibility of their research, analyze the research, etc. It may be important to have them identify the key idea they want to communicate, then think about how they want to “show” that with graphs, maps, icons, etc. Charting out their ideas on paper may be a necessary step for younger grades.
Good luck!
Catlin
Would you be willing to share a finished product? I’m super curious to see what how the students presented the information.
Hello Ashley,
I just uploaded 2 examples of student-designed infographics per your request!
Catlin Tucker