Last year my students designed infographics for the first time. I enjoyed the process and the products. It was a fun strategy to teach my students crucial research skills while encouraging them to think creatively about how to visually communicate information.
This year I was literally blown away by the work my students did on their infographics. I wanted to share my process and examples of student work to help support other teachers.
Step 1: Submit a Proposal
Students were encouraged to select a topic that interested them. Then they had to submit a proposal via a Google Form I created. I was able to provide feedback on their proposed topics before we began working on the actual infographics.

Step 2: Research, Research & Research Some More!
After every student received feedback on their proposal, we began the research component. I required my students to use a minimum of three credible online resources. We discussed research strategies, and they read my Google search blog post to learn how to search smarter. Since they were going to create an infographic, I also shared this cool Get More Out of Google Search infographic with them.
Step 3: Evaluate the Credibility of Digital Sources
My students had to complete my “Got Credibility?” Google form for each of their three online sources to ensure they were credible.
I also required that students use their Diigo accounts to annotate their online resources and share them with me via email. This encouraged them to actively read the information they were planning to use for their infographics.
Step 4: Explore Infographic Tools
I encourage my students to choose and use the technology that they are most comfortable with or that meets the needs of a particular task. A one-size-fits all approach to using technology is easier for the teacher, but can actually limit the student’s creativity. I shared three different infographic creation tools with my students and scheduled time in the computer lab for them to “play” with the different tools to see which one they preferred.

Step 5: Check Out Infographics
Before students can effectively design an infographic, they must have a clear sense of what an infographic does and what an infographic looks like. This helps them to better understand how they can show information in a dynamic way without relying on a lot of words to explain the research.
I used my homework blog to link to a variety of different infographics on topics related to what we were reading in class. During our Of Mice and Men unit, I linked to infographics on both mental health and mental illness in America. When we read To Kill a Mockingbird, I linked to infographics focused on racial inequality in the justice system, the death penalty, and the prison system in the United States. These visual displays of information were a powerful way to expose my students to facts and research and help them to conceptualize what infographics look like.
Visual.ly has a huge collection of infographics on a variety of topics. Students can search “entertainment,” “health,” or “environment” to view infographics on topics they are passionate about.
I’d suggest building time into your class to allow for this exploration. Ask student to critique different style of infographics and discuss the following:
-
- What strategies or visuals were you drawn to or felt were particularly effective?
- How was the information displayed?
- What type of organization did you prefer when looking at the infographics?
- Were there any elements you did not care for?
- What strategies would you like to replicate in your own infographic?
Step 6: Storyboard
Students had to submit a storyboard of their ideas either on paper or using Google drawing to reflect their pre-design process. I wanted my students to think about their approach to designing their infographs (organization, information and visuals) prior to going into the computer lab.
Below is a storyboard one of my students created and submitted using Google drawing.

Step 7: Design Infographics
Depending on your access to technology this may need to happen in a computer lab, at home or a combination of the two. I booked two 90 minute blocks in our computer lab, but I know most of my students also worked on their infographics at home. Luckily, my students’ work was saved to Easel.ly, Piktochart or Infogr.am and accessible from any computer.
Here are some of the incredible infographics my students designed this year!

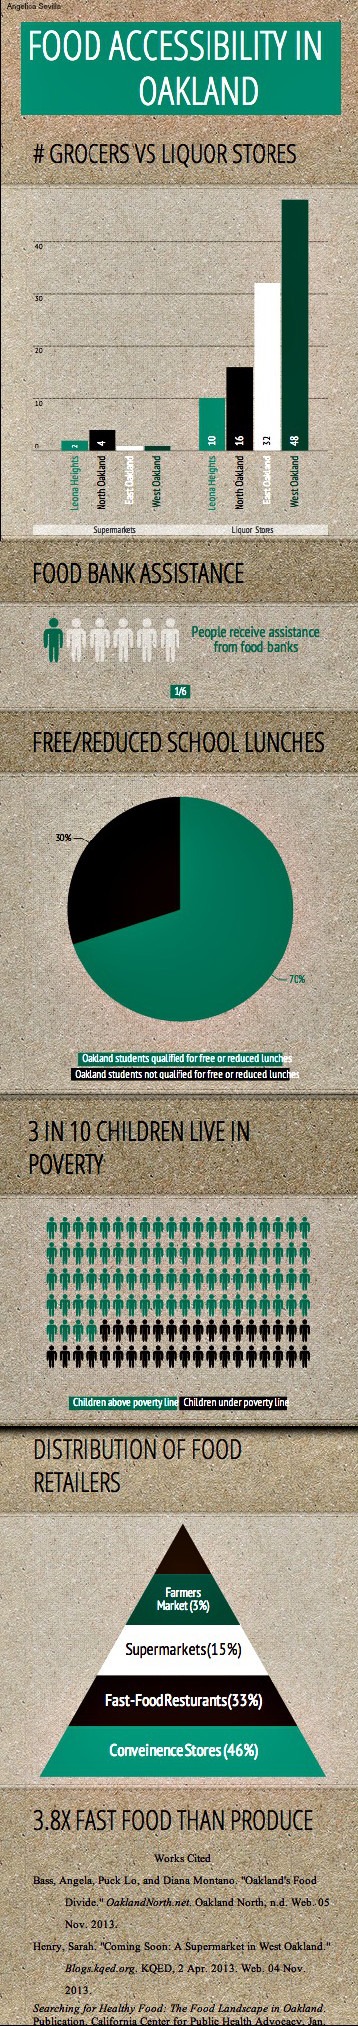


I love that every infographic was unique. Students focused on topics they were interested in researching, used the tools that worked best for them and created finished products they could share with the world!
55 Responses
[…] Student Designed Infographics: Process & Products @CTuckerEnglish (Wow!) catlintucker.com/2013/11/studen… […]
I haven’t figured out a way to have my students use diigo and share it with me in a way that is efficient. I don’t have time to open 180 emails to check their work. What’s the most effective way that you use diigo?
Hi Kristen,
You can create a group and have students annotate collectively on a single resource. That allows you to see all of their annotations in one place.
I typically do have students share their work via email. I find it quicker to scroll through their emails than to collect paper notes or annotations.
Catlin
Catlin,
I love this lesson, and plan on using it. I have few questions: Is this an individual assignment? It looks like it is. Do you have ideas for how infographics could be part of a PBL project?
My other thought is you could use infographics to substitute for the traditional research paper or as prewriting for a research paper. Have you used them in those ways?
Do you have your students present their infographics to the class? How do you publish their results so you get that authentic audience?
I’m excited that you will be coming to my school (ACHS) to train Humanities teachers on the Common Core.
Scott
Hi Scott,
Infographics are a very dynamic way to share and publish the outcomes of a PBL project. I have used them for this exact purpose, but allowed students to decide how they want to publish their PBL work (website creation, infographics, video, etc.).
This year, I did replace a traditional research paper with an infographic assignment. It was a huge success. My students practiced research skills (searching, evaluating credibility and citing sources), but they also learned how to strategically use digital media to visually show their research. They also enjoyed the process more. That is not to say they are not doing research writing. There is a lot of research involved in their argument writing.
My students do present their infographics to their peers. They will also include them in their digital portfolios to get feedback from a larger audience, which is exciting.
Take care.
Catlin
Catlin,
We launched our project using Google Draw and Infographics today. Students will be using their infographics to answer the question “What makes us human?” using information from Big History and other sources. We showed our students your student examples of infographics.
I was wondering if you have developed or know of a good rubric to assess infographics?
Scott
[…] Student Designed Infographics: Process & Products | Catlin Tucker, Honors English Teacher […]
Caitlin,
I absolutely love this info graphic idea! I am very excited to implement using infographics to bring in important facts students should know about the background of the novels they are reading (great ideas you suggested with To Kill a Mockingbird and Of Mice and Men). I had a look at visual.ly, but I wanted more historical information/data about discrimination rather than current data. Also, I noticed that wikipedia was cited as one of the sources of the infographic, as these graphics are published by users rather than companies. How you do you maintain accurate information of the infographics you use in the classroom? Also, do you have additional websites that you use that would have more variety of data? I plan to also have students create infographics as visuals for their persuasive argument presentation. excellent resource–thank you!
[…] Student Designed Infographics: Process & Products | Catlin Tucker, Honors English Teacher. […]
[…] See on catlintucker.com […]
[…] See on catlintucker.com […]
[…] See on catlintucker.com […]
Hi Catlin,
Any suggestions for helping students discover topics they’re interested in? Did they pull ideas from their writer’s notebooks? Start with a basic Google search? Check the news? The topics your students explored are wonderfully diverse…what kind of direction did you give them for topic selection?
Thanks!
Hi Allison,
I encouraged my students to select a topic they were passionate about to focus on for their research. We brainstormed on a Padlet Wall, they engaged in online discussions and, ultimately, selected their topics. They submitted their topics to me via Google Form so I could make sure the scope of their topic wasn’t too broad for an infographic. After each student received feedback on their proposal, they began their research. I was delighted with the variety as well. That’s what happens when you give them autonomy to pursue their interests.
Good luck!
Catlin
[…] Tucker, C. (2013). Student designed infographics: Process and products. Retrieved from http://cluttered-record.flywheelsites.com/2013/11/student-designed-infographics-process-products/ […]
[…] school. Your Students Can Easily Create Infographics. A Periodic Table of Visualization Methods. Student Designed Infographics: Process & Products. Last year my students designed infographics for the first […]
[…] http://cluttered-record.flywheelsites.com/2013/11/student-designed-infographics-process-products/ […]
[…] Blog, I came across another blog around blended learning and technology in the classroom. Catlin Tucker’s blog shares one of her assignments through student designed infographics. Tucker suggested using […]
[…] @Catlin_Tucker Student Designed Infographics: Process… with student samples catlintucker.com/2013/11/studen… […]
[…] Last year my students designed infographics for the first time. I enjoyed the process and the products. […]
[…] http://cluttered-record.flywheelsites.com/2013/11/student-designed-infographics-process-products/ […]
[…] @Catlin_Tucker: Student Designed Infographics: Process & Products catlintucker.com/2013/11/studen… […]
[…] Infographics […]
[…] Infographics […]
Infographics helps to share a vast subject into simple and informative manner.
[…] out an Honors English teacher’s blog post on how her students navigated the process; the infographics above and below are from her […]
This was something that has been added to my curriculum and I was very lucky you had all this information. I actually took alot of your steps and used them to create a hstry.co timeline of how students should create this research project. I wanted to thank you for sharing and providing inspiration to the rest of us.
Hi Jessica,
Thank you for the wonderful comment! I’m thrilled if the work I do makes it easier for another teacher attempting to do the same assignment, lesson, or project after me. I’m so glad my blog was useful to you!
Catlin
Just want to ask permission if I can use one of your infographics in our school news paper as one of my science articles.. thank you.. hope for your positive response..
Hi Joanne,
You are welcome to use it if you cite it properly.
Thanks,
Catlin
[…] students are currently in the early stages of research for an infographic project. In the past, I’ve had them explore and evaluate a range of infographics, so they can […]
Hi
I really enjoyed reading your article, as I want my students to be able to use an infographic as one option of a way to present an argument. I am wanting to know if you give permission for me to share the healthy vs not healthy child infographic with my students as a model. I appreciate this, as they have done a good job.
Yes, you are welcome to use that as an example!
Take care.
Catlin
Thanks a lot for your permission, I know my students will be wowed and hopefully inspired by them:)
Of course! I hope it inspires your kids.
Catlin
[…] 2. Infographics […]
Hi Catlin, I love your blog post. Soon I’ll be teaching a Technology in Education course for prospective teachers. Can I use the black-green solution and healthy vs. unhealthy infographics as examples for my class? We will be learning about using infographics as a form of assessment. Thanks so much!
Yes, you can use it if you give credit to Marco Coletti. He is the student who designed that infographic.
Thank you.
Catlin
Perfect! Thank you very much 🙂
Do you use the free components of easel.ly, piktochart, and infogr.am, or do you have education accounts? I’m just trying to figure out the best way for my students to share their work with a wider audience, and the ability to download a PDF seems to be something you have to pay for. Any ideas on the best ways to share this work? Thank you! I’m looking to add an infographic component to a project I’ve done in the past, and I’m so excited to use your fantastic resources.
Hi Elizabeth,
Yes, we use the free versions. The infographics can be saved as image files (.jpg) and then inserted in a Google Drawing, blog or website to share. Alternatively, they can be dragged directly into Google Drive and shared so “anyone with the link can view.”
Good luck!
Catlin
I have my students login on my printer-connected computer. (I have a wide-format printer using card stock.) The download low quality for easel.ly is free. Then, I open the picture using the Windows Gallery feature on my PC. I can easily print from there.
My groups each receive 10 copies of their infographic to post in public places around our city. They must provide photographic evidence of the place to prove it is public. (We are working on writing/producing for real audiences this year.)
[…] if you’re a teacher interested in incorporating these concepts into your classroom. Similarly, Catlin Tucker comments on how teaching infographics gave her students useful skills, and gives several examples […]
Wonderful lesson and full of great information.
Did you have a rubric you use for your infographics?
Thanks,
Rachel
I am currently searching for a rubric as well.
[…] interesado en cómo incorporar estos conceptos dentro del salon de clases. De manera similar, Catlin Tucker comenta como la enseñanza de infografías les dió a sus alumnos habilidades prácticas, mostrando […]
[…] better when they have to synthesize and create something knew from what they are learning. Create assignments that help students engage with the content using higher order […]
This is amazing! Thanks! I plan to do this with my students starting this week. I will keep you posted.
[…] if you’re a teacher interested in incorporating these concepts into your classroom. Similarly, Catlin Tucker comments on how teaching infographics gave her students useful skills, and gives several examples […]
[…] if you’re a teacher interested in incorporating these concepts into your classroom. Similarly, Catlin Tucker comments on how teaching infographics gave her students useful skills, and gives several examples […]
[…] – Infographic Source – […]
Hello Catlin,
Some of my students will be creating infographics to inform their schoolmates about their Constitutional rights at school. May I use some of the infographics you show here as examples for my students. If so, can you give me the name of the students who created them so I can give them credit?
Hi Cynthia,
You are welcome to use them as examples for your students. I received permission to share them years ago, but I don’t have their names on the blog post so I am not sure which infographic belongs to which students. I could probably dig that information up, but I think it is okay to use them as is. Thank you for checking with me though!
Catlin
I would like to empower my teachers with teaching their students with infographics. Do you know of “free” sites the students can explore already made infographics prior to them creating one? I know you mentioned it was important for them to view them and analyze them before creating.
Hi Melissa,
There are many example infographics on Canva, which has a free version. The post you read is so old that Canva was not available when I did that work with my students. If it had been, I definitely would have used it!
Best,
Catlin